Introduction
What is Website Analytics?
Website analytics is like the digital equivalent of listening to your customers’ conversations in a store. It involves collecting, analyzing, and interpreting data about your website’s visitors. This includes where they come from, what they do on your site, and how long they stay.
Table of Contents
Importance of Website Analytics for Online Success
Think of website analytics as your roadmap to online success. Without it, you’re driving blind. It helps you understand what’s working and what’s not, so you can make informed decisions to grow your site.
Setting the Foundation for Analytics
Choosing the Right Website Analytics Tools
Not all analytics tools are created equal. Popular choices include Google Analytics for its robust features, Hotjar for heatmaps, and Crazy Egg for A/B testing. These tools cater to different needs, so choose one based on your goals.
Installing and Setting Up Analytics Software
Once you’ve picked your tool, it’s time to integrate it with your site. For instance, Google Analytics requires embedding a tracking code. Don’t worry, it’s simpler than assembling IKEA furniture!
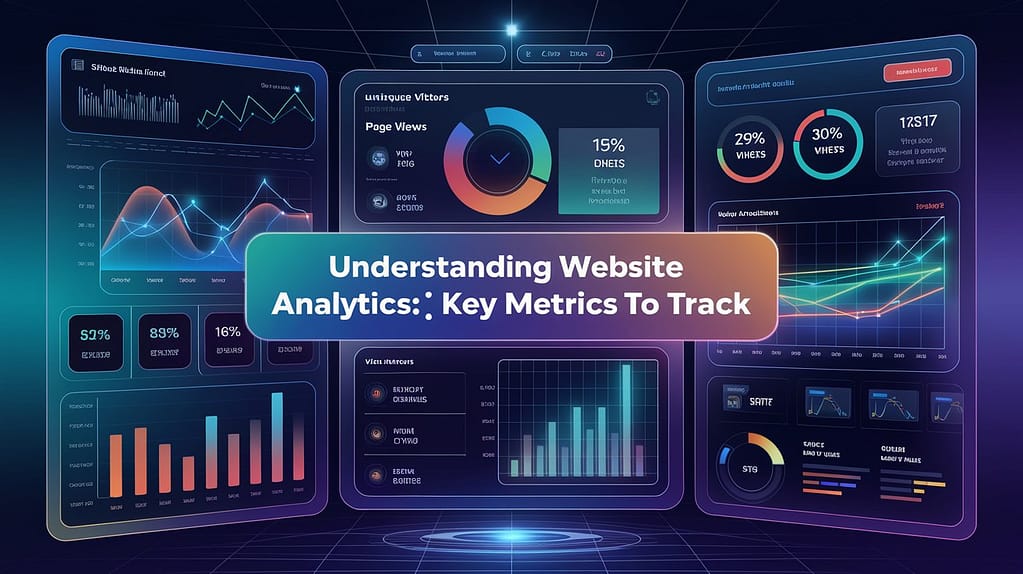
Key Metrics to Track in Website Analytics

Traffic Sources
Understanding where your visitors come from is essential.
- Organic Traffic: Visitors who found you via search engines.
- Referral Traffic: People who click on links from other websites.
Bounce Rate
An elevated bounce rate might indicate an issue, as it reflects visitors leaving after checking just one page. Aim to keep this low by improving your content and navigation.
Session Duration
This metric tells you how long users stay on your site. The longer, the better—it means they’re engaged.
User Behavior Insights
Pages Per Session
Are visitors exploring multiple pages, or are they one-and-done? Higher pages per session indicate better engagement.
Heatmaps for Visual Insights
Heatmaps reveal the areas of your site that attract the most user interaction. Tools like Hotjar make this super easy to visualize.
Conversion Tracking
Tracking Sales and Signups
Curious about how many of your visitors turn into paying customers? Set up conversion tracking for actions like purchases or email signups.
Understanding Conversion Rates
Divide your total conversions by the number of visitors, and voilà—your conversion rate! Aim to improve this consistently.
Audience Demographics and Interests

Age and Gender Insights
Knowing your audience’s demographics helps you tailor your content. For example, if most visitors are millennials, focus on trends they care about.
Geographic Location
Are you attracting a global audience or staying local? Location data can guide your advertising efforts.
Device and Browser Analytics
Mobile vs. Desktop Usage
With mobile traffic surpassing desktop in many cases, make sure your site is mobile-friendly.
Browser Compatibility
Check how your site performs on different browsers. Chrome users might have a different experience than Safari users.
SEO Performance Metrics
Keyword Rankings
Track how your target keywords perform in search engine results. This plays a vital role in enhancing your SEO approach.
Backlink Analysis
High-quality backlinks are like votes of confidence for your site. Use tools like Ahrefs or Moz to monitor them.
Tracking Content Performance
Popular Pages
Identify which pages get the most traffic. These are your star players, so give them extra attention.
Content Engagement Rates
See how users interact with your content—comments, shares, and time spent are all good signs.
Using Analytics for A/B Testing
Experimenting with Different Layouts
Test two versions of your website to see which performs better. A/B testing is your playground for optimization.
Testing Call-to-Action Effectiveness
Even tweaking a button color can skyrocket your clicks. Test, learn, and refine.
Social Media and Campaign Tracking
Monitoring Campaign ROI
Use UTM parameters to track how your social campaigns perform. It’s like tagging your luggage before a flight—you’ll know exactly where it came from.
Social Media Referral Traffic
Measure which platforms drive the most visitors. Focus your efforts on the ones that work best.
Identifying and Fixing Problems
Spotting High Exit Pages
High exit rates on specific pages? That’s your cue to improve those pages.
Addressing Slow Loading Times
Nobody likes a slow site. Use tools like PageSpeed Insights to fix this.
The Role of Custom Dashboards
Creating Tailored Views
Custom dashboards let you focus on the metrics that matter most. It’s like curating your favorite playlist.
Automating Reports
Save time by automating weekly or monthly reports. Google Data Studio is a lifesaver here.
Leveraging Analytics for Affiliate Marketing
Understanding Affiliate Clicks
Track which links your visitors click most. This is crucial for optimizing affiliate sales.
Optimizing Affiliate Conversions
Analyze conversion rates to refine your strategy. Prioritize products that align with your audience’s interests and needs.
Final Thoughts on Website Analytics
Continuous Improvement Using Data
Analytics isn’t a one-time thing. It’s an ongoing process to refine and improve.
Staying Updated with Analytics Trends
Keep learning about new tools and metrics. The digital world evolves fast—stay ahead of the curve.
FAQs
1. What is website analytics, and why is it important?
Website analytics helps you understand visitor behavior, improve your site, and boost conversions.
2. Which are the best website analytics tools?
Tools like Google Analytics, Hotjar, and Ahrefs offer comprehensive insights.
3. How can analytics improve my SEO strategy?
By tracking keywords, bounce rates, and backlinks, you can fine-tune your SEO efforts.
4. What metrics are crucial for tracking e-commerce performance?
Conversion rates, cart abandonment, and average order value are essential metrics.
5. How often should I review my website analytics data?
At least weekly, but daily checks can help spot trends faster.